Overview
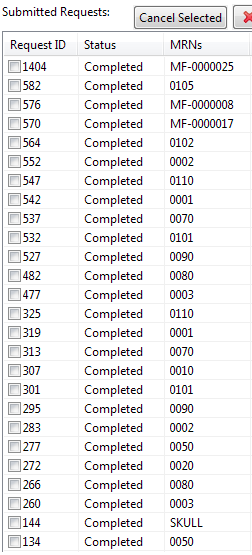
Most of the data are shown in tables in the mib2 client. These tables support sorting and filtering. Here we use the Request Management UI (Tab 3) as an example to show how users can sort and filter tabular data.
Sorting
In general, users can click on the header of each column to sort the rows by that column. The first click will sort the column in ascending order, the second click results in descending order, and the third click results in the original order, resetting sort. For example, sorting by Request ID (the 1st column) in Tab three resembles the following screenshots. Note the a a sorting arrow in the highlighted column header for "Request ID" for each of the ascending and descending sorts.
Ascending Order by Request ID
Descending Order by Request ID
Users can apply sorting to to all data in the table" dates (such as Study Date), texts (Modalities, Comments, MRNs Request ID's), time (Download Time Remaining), file size, etc.
The one place where sorting is limited is in Tab 1. The table in Tab 1 is actually a tree structure to support displaying patients that have the same MRN. A tree is not amenable to sorting on all columns like tables are. Instead, users can only sort the patients by their MRN.
Filtering
In the tables in Tab 1, 2, 3, and 5, users also have the option to filter the rows. The only table that is not filterable is the Download Manager in Tab 3. We use Tab 3 to illustrate the filter functionality.
By selecting the "Show Filter" button in each of Tab 1, 2, 3, or 5, users can access the filter widgets. Press the same button again (now "Hide Filters"), users can hide them.
The mechanics filtering is simple. There is a set of widgets corresponding to each column of the table. By appropriately selecting only the values users want to see in that column, the filter will automatically hide the rest. For example, if users want to see only "Magnetic Resonance", they would select only "Magnetic Resonance" in the filter widget corresponding to the column "Modality". If the users want to see studies that either "Magnetic Resonance" or "Computed Tomography", users would then have those two selected in the widgets.
There are two types of filter widgets in mi2b2 client. The first is a Range Slider. It is a scroll bar with two end points that users can move independently. The values between (and including) the two endpoints are the values that users select, and the rest are filtered out. This type of filter is useful for values that can be meaningfully ordered, such as dates, or have many values (such as MRNs). By default, a Range Slider selects all values in the table (nothing is filtered). The minimum and the maximum values are always displayed. The filter action takes place when users release the dragging action of the end point controls. Once a range is set, users can also drag the range thumb to move both the upper and lower end point controls simultaneously.
A second type of filter widgets is a group of checkboxes. mi2b2 will filter out any checkbox that is not selected. By default, all checkboxes are selected (nothing is filtered).

